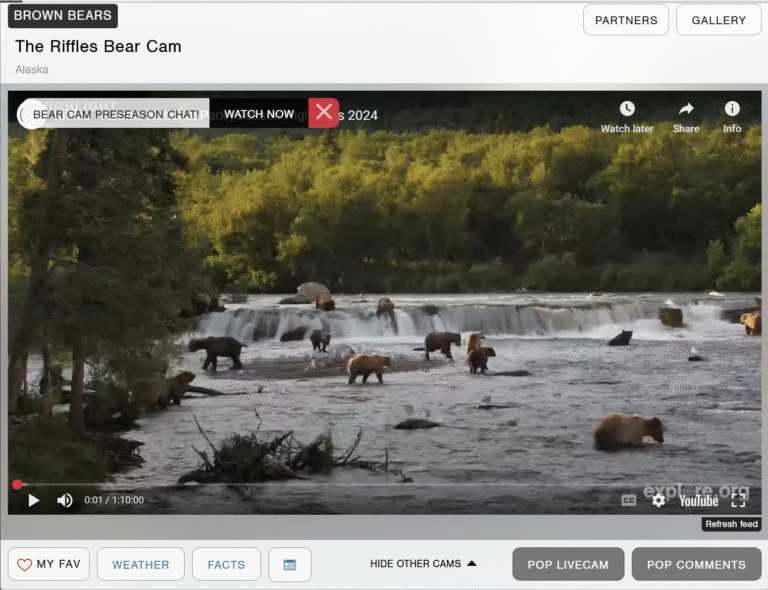
How many bears will be at the Riffles to eat the salmon in Katmai National Park on a peak day? How large will a glacial outburst flood be in 2025 at its peak on the Mendenhall River? What will be the snowpack level be next year at a key time that defines both the risk for snowmelt flooding and water supply in the Pacific Northwest? There is a lot of interesting information out there and we rely on science to try and give us a hint at what is coming next. But much like fantasy sports, science helps to identify trends but nature’s variability can humble the best of us. This is just an attempt to find a fun way to track what is happening in the world and test how well we understand what is happening out there. This will likely take some time to develop as I am new to making apps but let me know your thoughts/suggestions. Here are some links to the sites of interest for those first 3 questions I posed that allows one to see for themselves without the need for interpretation:
Webcams – Katmai National Park & Preserve (U.S. National Park Service)
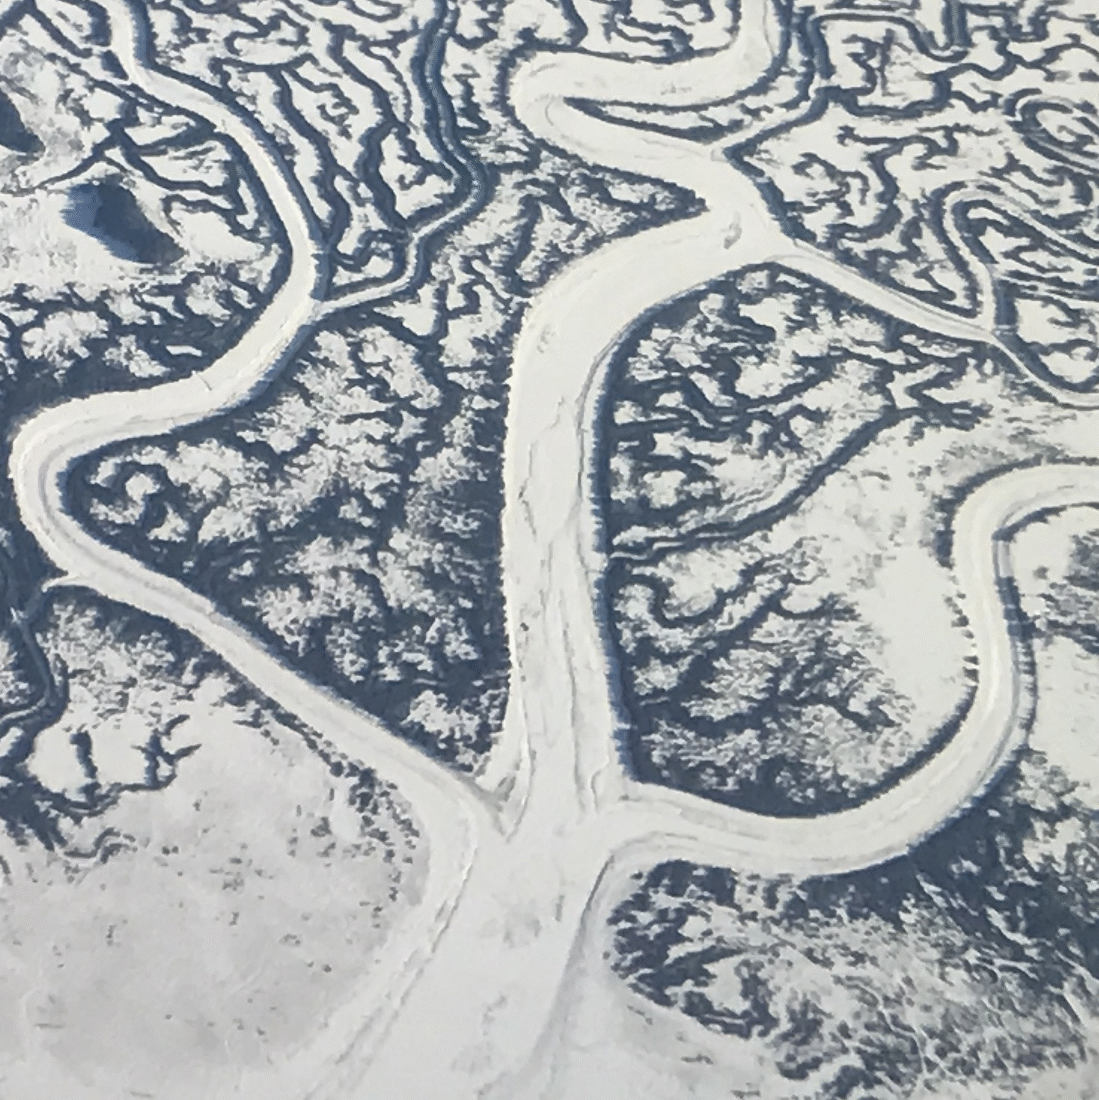
Hidden Water: The Suicide Basin Outburst Flood
Mendenhall R NR Auke Bay AK – USGS Water Data for the Nation
Hello,
I’m a University of Arizona Graduate student in the GIST program and I’m currently working on my thesis research project. My project is focused on finding optimal flood barrier locations around the city of Burlington WA using GIS software. I’m having trouble finding GIS data related to 10, 50, 100, 500 year flood hazard zones. If you have any insight or sources that you could share with me that would help me out a lot! I’m looking for BFE values if possible.
Thank you!
Hi Kevin,
Sorry for the slow response. The answer to your question is a bit complicated. The official FEMA floodplain maps are outdated and not in a digital format. They can be found at https://msc.fema.gov/portal/advanceSearch and then select the state and county.
For designing a flood barrier for the city of Burlington, the best data I know of is the preliminary maps that were done in the 2010 timeframe but never were completed. They are not online anywhere but you could likely reach out to FEMA Region 10’s Regional Service Center. I believe their contact information can be found here: https://hazards.fema.gov/femaportal/resources/rsc_contacts.htm
and Washington State is Region 10. Josha is quite helpful and his contact information is shown as:
RSC10 Lead: Josha Crowley
Josha.Crowley@atkinsglobal.com
(425) 329-3679
He should be able to find that GIS data for you. If not, let me know as I believe I have the information as well and we can find a way to transfer it to you.
It is also possible that Skagit County and/or the city have some thoughts and access to what the best data there is for this type of work. I know they have studied this in a lot of detail. You might try their Emergency Management phone number that is shown on this site:
https://www.skagitcounty.net/Departments/Flood/Main.htm
I hope that helps.
Ted